Blue is the New Green
This posting plots numerous measures of the individual states of the United States with a blue-red gradient. The electoral map of the 2004 Presidential election correlates remarkably to measures such as gross state product, per capita income, federal taxes paid vs. received, number of state employees, college education rate, infant mortality rate, obesity rate, and divorce rate. An explanation for this correlation is how industries within the United States have gravitated to distinct geographic area, as shown in the following map.
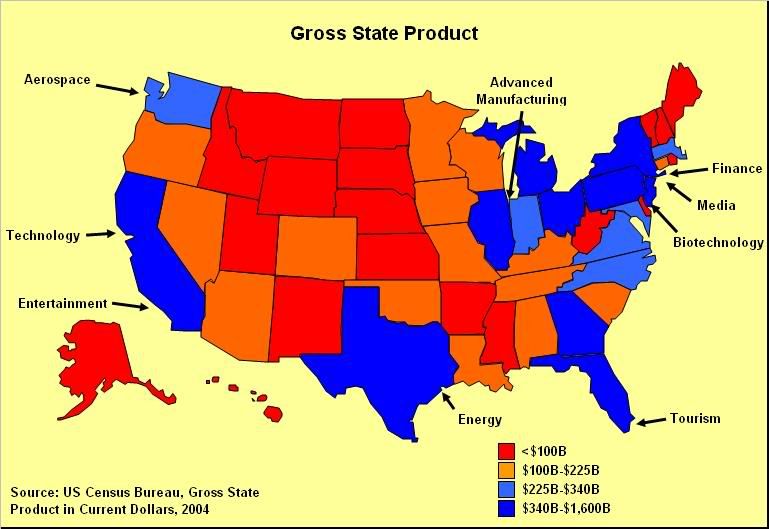
California hosts two industries, Technology in San Francisco/Silicon Valley and Entertainment in Los Angeles. New York City hosts both the Finance and Media industries in one city. Advanced Manufacturing is hosted in the Great Lakes region, centered on Chicago. Seattle hosts Aerospace and New Jersey hosts Pharmaceuticals along the I-95 corridor. All of these industries require intensive intellectual capital.
Florida's Tourism and Texas' Energy industries are presenting in orange since they do not require intellectual capital. Florida has become the United State's center of Tourism, with huge influxes of Latin American and European visitors every year. While the Tourism industry does not require intellectual capital, it is a modern services business that is growing in particular areas worldwide.
Texas's Energy focus is the last successful industry in the United States that relies on excavation of natural resources rather than intellectual capital or services. Next generation energy development is concentrated in Northern California (solar) and in the Great Lakes area (power cell). Agriculture is not included as an area of competitive advantage since agriculture in both the United States and the European Union is protected with government subsidies from competition from developing nations. Hence the agricultural center of the United States does not have any financial strength or competitive advantage.

Virtually all of these industry concentrations correspond to the Democratic "blue states". Florida with its Tourism concentration is a "swing state". Texas with its Energy concentration is the lone exception or a red state that hosts an industry concentration, with the caveat again that it is an industry that relies on excavation of natural resources rather than intellectual capital.
While industries are primarily concentrated in particular regions, there are some outlying areas that are affiliated with that industry that are located in electoral red states. Examples include the technology industries in Austin, Texas and Research Triangle Park, North Carolina. Typically, these types of areas are blue counties hosted within red states. Travis County, home to Austin, Texas, voted for Kerry-Edwards 56% to Bush-Cheney 42%. Durham Country, home to Research Triangle Park, North Carolina voted in for Kerry-Edwards 68% to Bush-Cheney 32%.

The regions with industry concentrations have much higher Gross State Product than regions with no industry concentrations.
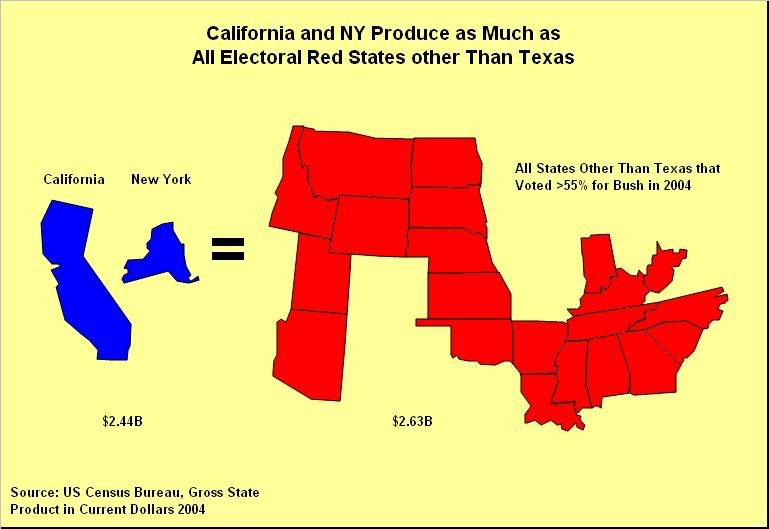
In fact, the Gross State Products of just California and New York are almost as much as all of the electoral red states other than Texas combined.
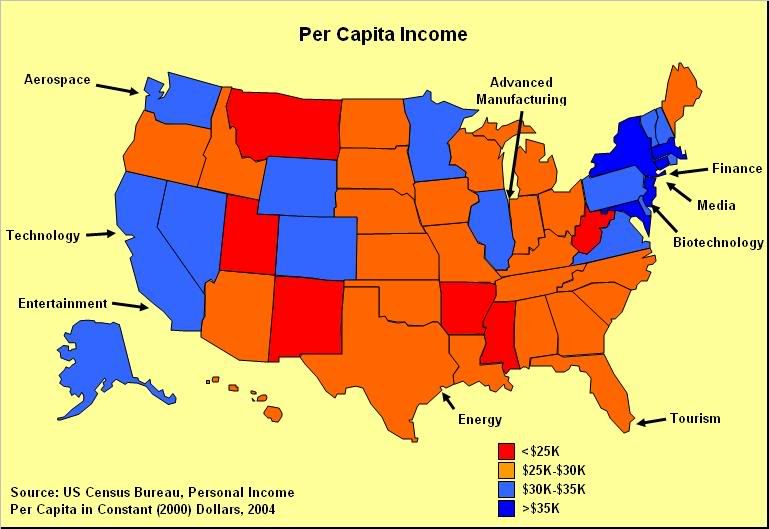
In addition, the regions with industry concentrations also have much higher per capita income, other than Texas's Energy and Florida's Tourism, since these industries do not require as much intellectual capital.
Although the blue states produce far more than the red states, they consume far less electricity per capita. California's electricty use per capita has been flat since the mid-1970's, while the the U.S. average has risen over 50%.

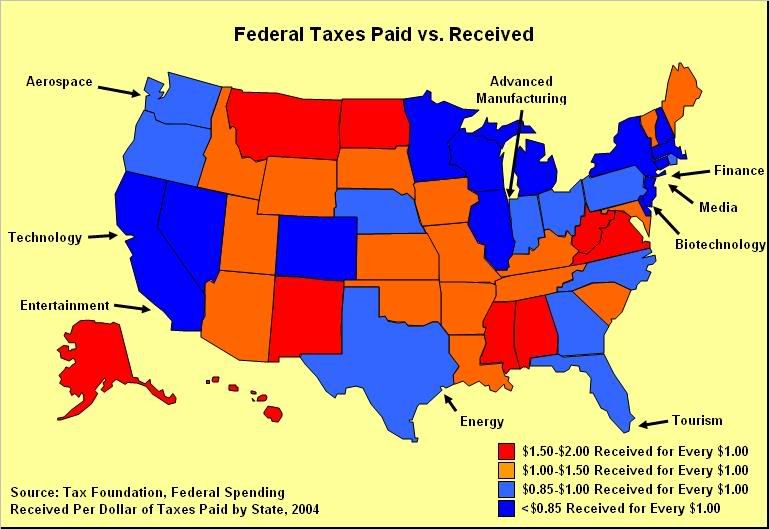
Given the concentration of wealth created by industry centers, these states contribute more than they receive in Federal taxes. In effect, the blue states are subsidizing the red states.
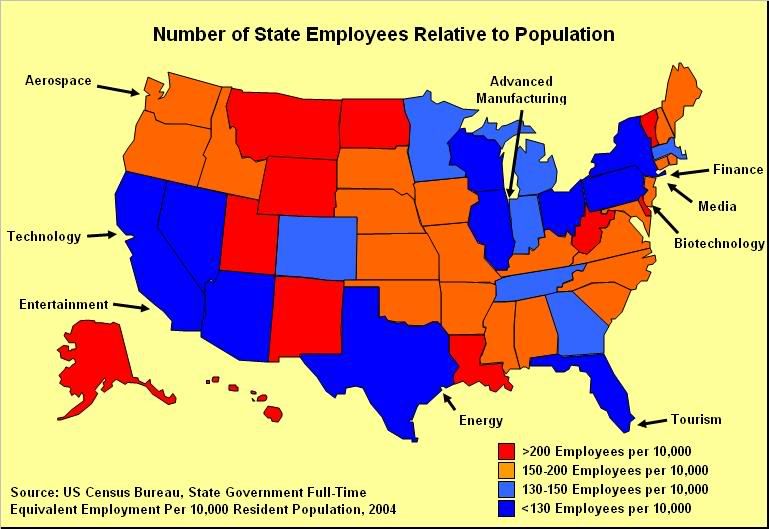
This effect also follows into state governments, where the red states hire more employees relative to their populations than the blue states. This is counter to the common supposition that blue states have bigger governments. Yet it is common for countries that have little economic potential to hire many government workers, each at a low wage.
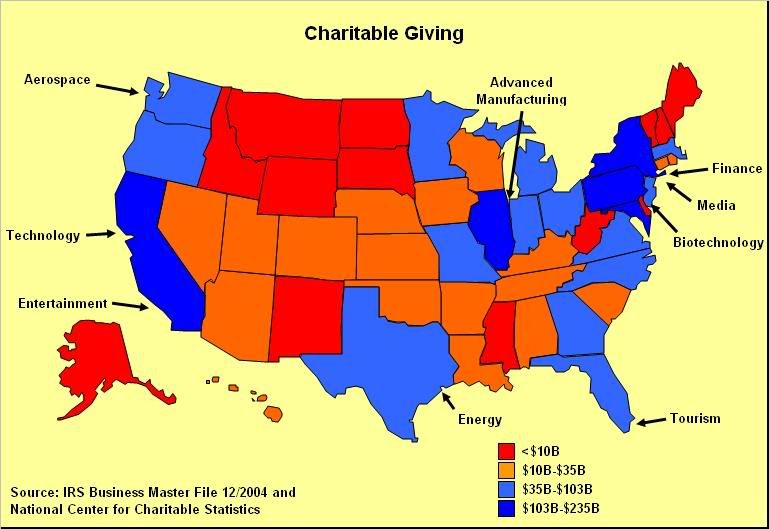
The Blue States share a lot of their wealth, giving the most to nonprofits. Texas, in comparison, gives less than Maryland or Pennsyvlania.
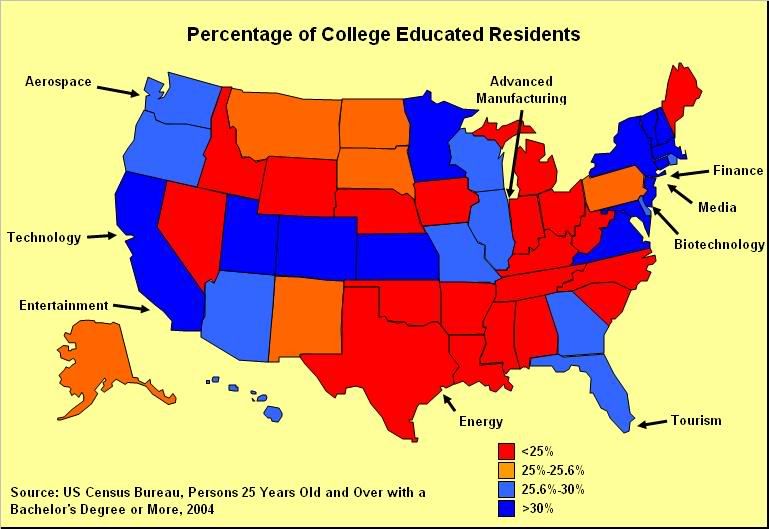
There are distinct demographic differences between the wealth generating blue states and the red states. Given their industrial reliance on intellectual capital, it is no surprise that the blue states have more college educated residents relative to their populations.
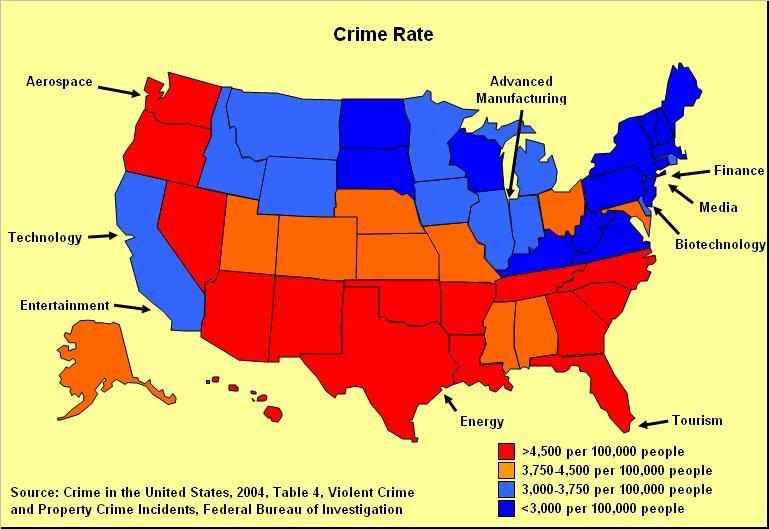
The blue states also have a lower crime rate than the red states, which is suprising given the popular conception that there is more crime in urban areas. The distinction clearly is that the crime in the blue states is concentrated in cities and therefore much more apparent, while crime in the red states is more spread out.
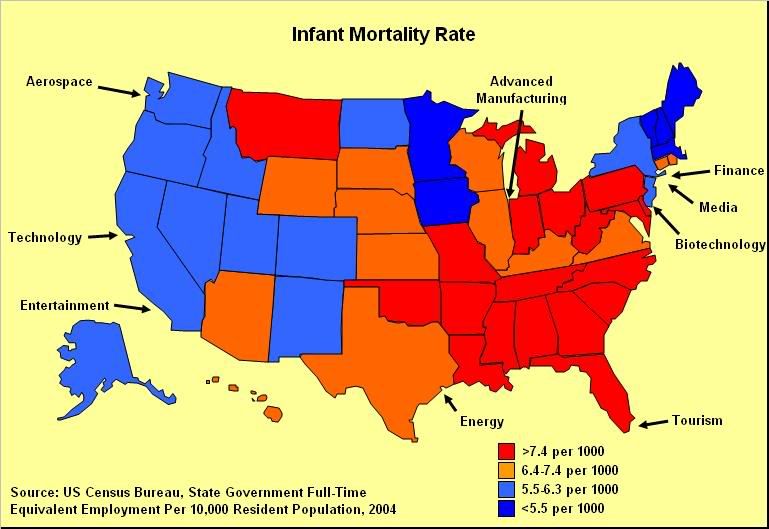
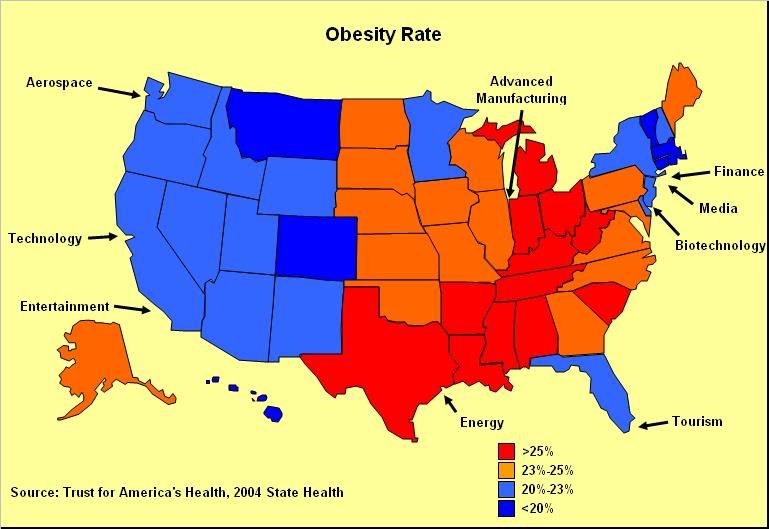
A good indicator on the health of a society are infant mortality and obesity, since these are metrics that are independent of judgment or opinion. The electoral red states have a higher incidence of both infant mortality and obesity, particularly in the "bible belt."
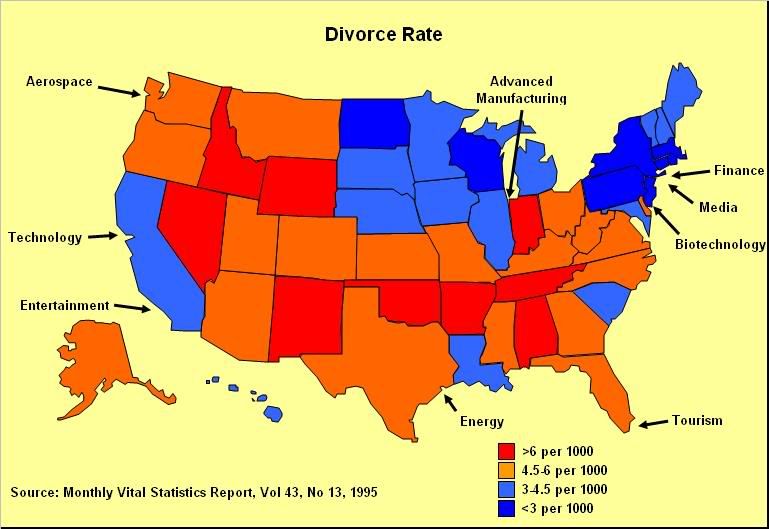
The divorce rate also shows higher incidences in the electoral red states, but this is a little more subjective since it is influenced by cultural norms such as marrying younger.
The data presented here is from non-partisan sources, primarily the US Census Bureau. The data is plotted with a blue-red gradient, and it clearly shows that the blue states generate the majority of the wealth in the United States, subsidize the red states financially, and that blue state residents have a healthier quality of life. The only exception is Texas, whose oil-based Energy concentration offers the financial benefits of a blue state with the demographics of a red state.
When the economic future of the United States is discussed, people point to industries such as technology, aerospace, advanced manufacturing, media, biotechnology, finance, and entertainment. All of the industries dominated by the blue states.
Clearly, blue is the new green (as in dollars).
UPDATE: Some folks have asked for the source data. I put up the spreadsheet I built to calculate all of this here.
California hosts two industries, Technology in San Francisco/Silicon Valley and Entertainment in Los Angeles. New York City hosts both the Finance and Media industries in one city. Advanced Manufacturing is hosted in the Great Lakes region, centered on Chicago. Seattle hosts Aerospace and New Jersey hosts Pharmaceuticals along the I-95 corridor. All of these industries require intensive intellectual capital.
Florida's Tourism and Texas' Energy industries are presenting in orange since they do not require intellectual capital. Florida has become the United State's center of Tourism, with huge influxes of Latin American and European visitors every year. While the Tourism industry does not require intellectual capital, it is a modern services business that is growing in particular areas worldwide.
Texas's Energy focus is the last successful industry in the United States that relies on excavation of natural resources rather than intellectual capital or services. Next generation energy development is concentrated in Northern California (solar) and in the Great Lakes area (power cell). Agriculture is not included as an area of competitive advantage since agriculture in both the United States and the European Union is protected with government subsidies from competition from developing nations. Hence the agricultural center of the United States does not have any financial strength or competitive advantage.
Virtually all of these industry concentrations correspond to the Democratic "blue states". Florida with its Tourism concentration is a "swing state". Texas with its Energy concentration is the lone exception or a red state that hosts an industry concentration, with the caveat again that it is an industry that relies on excavation of natural resources rather than intellectual capital.
While industries are primarily concentrated in particular regions, there are some outlying areas that are affiliated with that industry that are located in electoral red states. Examples include the technology industries in Austin, Texas and Research Triangle Park, North Carolina. Typically, these types of areas are blue counties hosted within red states. Travis County, home to Austin, Texas, voted for Kerry-Edwards 56% to Bush-Cheney 42%. Durham Country, home to Research Triangle Park, North Carolina voted in for Kerry-Edwards 68% to Bush-Cheney 32%.
The regions with industry concentrations have much higher Gross State Product than regions with no industry concentrations.
In fact, the Gross State Products of just California and New York are almost as much as all of the electoral red states other than Texas combined.
In addition, the regions with industry concentrations also have much higher per capita income, other than Texas's Energy and Florida's Tourism, since these industries do not require as much intellectual capital.
Although the blue states produce far more than the red states, they consume far less electricity per capita. California's electricty use per capita has been flat since the mid-1970's, while the the U.S. average has risen over 50%.
Given the concentration of wealth created by industry centers, these states contribute more than they receive in Federal taxes. In effect, the blue states are subsidizing the red states.
This effect also follows into state governments, where the red states hire more employees relative to their populations than the blue states. This is counter to the common supposition that blue states have bigger governments. Yet it is common for countries that have little economic potential to hire many government workers, each at a low wage.
The Blue States share a lot of their wealth, giving the most to nonprofits. Texas, in comparison, gives less than Maryland or Pennsyvlania.
There are distinct demographic differences between the wealth generating blue states and the red states. Given their industrial reliance on intellectual capital, it is no surprise that the blue states have more college educated residents relative to their populations.
The blue states also have a lower crime rate than the red states, which is suprising given the popular conception that there is more crime in urban areas. The distinction clearly is that the crime in the blue states is concentrated in cities and therefore much more apparent, while crime in the red states is more spread out.
A good indicator on the health of a society are infant mortality and obesity, since these are metrics that are independent of judgment or opinion. The electoral red states have a higher incidence of both infant mortality and obesity, particularly in the "bible belt."
The divorce rate also shows higher incidences in the electoral red states, but this is a little more subjective since it is influenced by cultural norms such as marrying younger.
The data presented here is from non-partisan sources, primarily the US Census Bureau. The data is plotted with a blue-red gradient, and it clearly shows that the blue states generate the majority of the wealth in the United States, subsidize the red states financially, and that blue state residents have a healthier quality of life. The only exception is Texas, whose oil-based Energy concentration offers the financial benefits of a blue state with the demographics of a red state.
When the economic future of the United States is discussed, people point to industries such as technology, aerospace, advanced manufacturing, media, biotechnology, finance, and entertainment. All of the industries dominated by the blue states.
Clearly, blue is the new green (as in dollars).
UPDATE: Some folks have asked for the source data. I put up the spreadsheet I built to calculate all of this here.
posted by Peter Yared at
8:20 PM
![]()


3 Comments:
Hi Peter,
I happened to find your blog through happenstance, and through my friend Graham. I find your analysis fascinating as it takes a lot of the so called "Christian" movement out of the equation. In a capital driven society in which we live, it is enlightening to see that you have taken the time to analyze the true driver of politics (aka Power), and that is the "green.".. Thanks for your insight..If you have a sec, I invite you to stop by my blog - http://entrepilar.blogspot.com
This comment has been removed by the author.
The link to the source xls file is broken. At the bottom of Blue is the new $Green$
"UPDATE: Some folks have asked for the source data. I put up the spreadsheet I built to calculate all of this here" is not found.
Post a Comment
Subscribe to Post Comments [Atom]
<< Home